knowledge-zone » PTE Speaking » How To Score in PTE Describe Image : Practice & Explanation
PTE Describe Image is the third prompt type task type in the speaking section. It’s also true that it is one of the most dreaded sections in PTE Exam. Somehow it is something to be afraid of.
Now consider a situation where you are given a unique image and you have to explain it promptly within 40 seconds. Sounds strange! right? Well, this is what happens in the PTE Describe Image.
You get an image (8 different types) which you have to skim through in 25 seconds. Once the skimming time is up, you have to describe the image in 40 seconds. No doubt; it is a difficult task but with a bit of strategy and the right tips, one can certainly reduce the difficulty and can score in the PTE.
We will talk about the same and entail a strong strategy that can help you score in PTE Describe Image. However, first of all, let’s talk about the type of image asked in in this task type of Speaking section.
Types of Images in PTE Describe Image
In PTE Exam, you will encounter eight types of images. Here is a list of images that can be asked in your next PTE Test :
- Bar Graph
- Line Graph
- Table
- Maps
- Pie Chart
- Flowchart diagram
- Venn Diagram
- Pictures
In the exam, you will be asked six different questions. The scoring is done on the basis of content, oral fluency and pronunciation. We have already discussed oral fluency and pronunciation in our previous blogs on PTE Read Aloud & PTE Retell Lecture. So we won’t be discussing them in this post. We will be rather focusing on a perfect strategy to score in PTE Describe Image.
Strategy To Get The Perfect Score
We are dividing the complete strategy into three parts or three steps. What you need to understand is that all these images need an introduction. So Part 1 becomes the introduction.
Part I: Introduction
You can often start with a generic statement that can describe the whole picture while at the same time can save the ordeal of making the statement. Here are a few statements that you can use :
The image talks about…..
In this picture, we are shown….
The graph gives an analysis……
You can use any of these starting statements, depending on the kind of image you are asked in the PTE Test.
Comparison of Data
It is true that each image is different, but you can always put in a data comparison between various components of the images. When you give or explain comparative data; it not only eases the execution time for you but also helps in easy sentence formation.
Conclusion
The conclusion is what you call the final statement. The last statement that ends your description. Now you can use templates like :
In conclusion, the image/picture is very informative
OR
The image predicts
OR
The image gives a vivid
The 40-second timer

You have 40 seconds to describe the image. So it is necessary to always keep a mental note of the allotted time. Always try to finish the answer within 40 seconds. Also do not speak before the beep sound starts. You can refer the PTE Mock Tests on our website for constant practice for the Describe Image questions as well as the below samples.
With that being said, let’s jump into some describe image PTE practice tests using the above-discussed strategy.
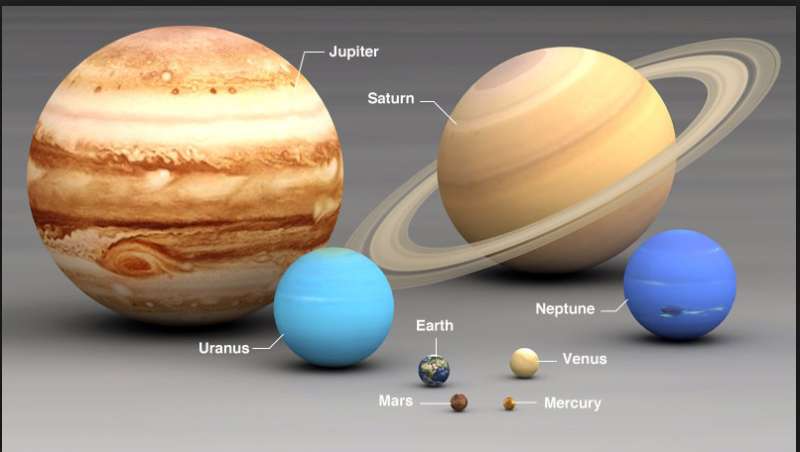
PTE Describe Image Sample Test 1 – Picture Image

Go on try to describe the image
Click here to view answer
The following graph gives information about the solar system. This is a lovely picture, and it shows a number of things. According to this graph, the largest planet is Jupiter; the colour of it is brown. You can see from this graph that, the second-largest planet is Saturn; the colour of it is brown and the smallest planet is Mercury, followed by Mars, Earth, Venus, Neptune, Uranus. In conclusion, this picture is very informative.
With the use of a strategy, Describe Image certainly becomes easy, but you should always focus on pronouncing the keywords correctly and as well as the correct use of grammar.
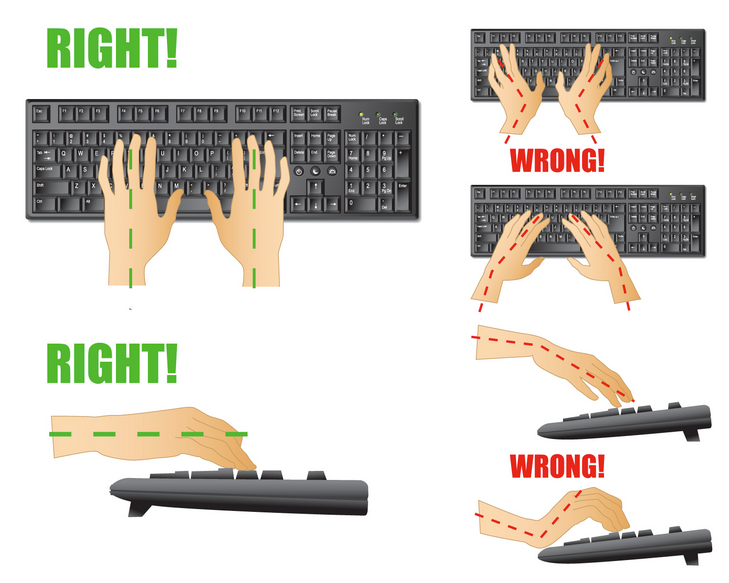
PTE Describe Image Sample Test 2 – Process Image

Go on try to describe the image:
Click Here To View Answer
In the upper left area, there is a keyboard, the colour of it is black, and there are hands that parallel with each other, which is right. In the lower-left area, there is a hand that parallels the keyboard. And it is the right gesture. In the upper right area, there are two hands that are twisted against each other, and it is wrong. In the second picture in the right area, 2 hands are the point in the opposite direction, which are wrong. In the third picture in the right area, there is a hand forming an angle with the keyboard. In the lower right area, there is a hand whose wrist forming a right angle. In conclusion, this graph is very informative.
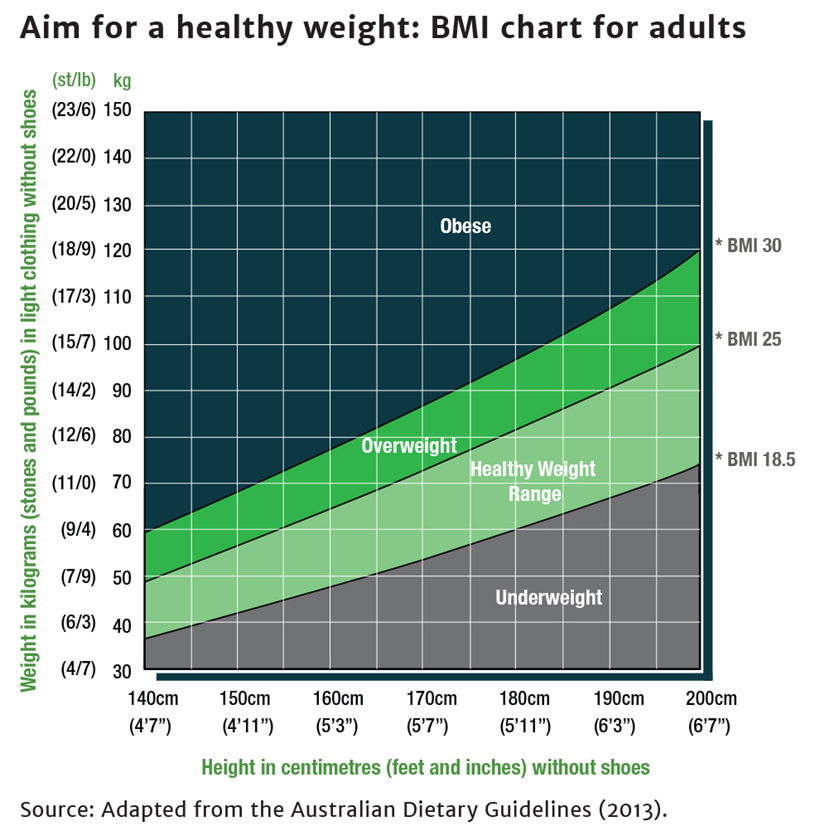
PTE Describe Image Sample Test 3 – Table

Describe the above image:
Click Here To View Answer
The following graph gives information about Aim for a healthy weight: BMI chart for adults. The graph shows the information about body mass index. The height is between 140 centimetres to 200 centimetres, and the weight is between 30 kilograms to 150 kilograms. It is clear that obese occupies the largest percentage, with the weight between 150 to 290. Followed by that, normally occupies the second-largest percentage above BMI 30, with the weight ranging from 60 to 120 kilograms. The BMI for overweight is between 25 and 30 and the BMI for a healthy weight range is between 18.5 and 25. In conclusion, this graph summarizes information about body mass.
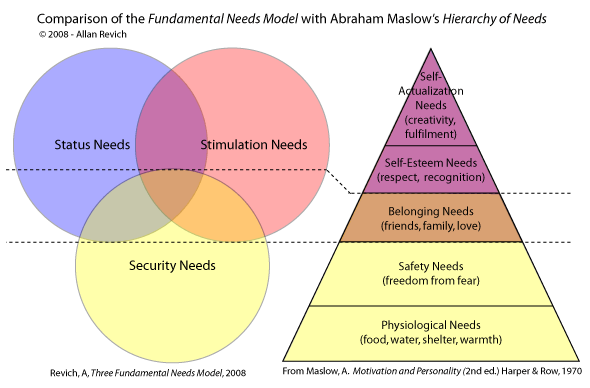
PTE Describe Image Sample Test 4 – Line Graph

Try to describe the image:
Click Here To View Answer
The following graph gives information about two different kinds of needs models. As we can see from the left-hand side, the needs can be divided into three kinds, which are status needs, stimulation needs and security needs. However on the right-hand side, we can see from the top to the bottom, there are five kinds of needs, which are self-actualization needs, self-esteem needs, belonging needs, safety needs and physiological needs. Specifically, safety needs mean freedom from fear and belonging needs mean friends, family, and love. In conclusion, the two models are similar in showing human’s different kinds of needs.
You can put all the above tips/strategies in constant practice and your PTE preparation strategy. If you have any doubts feel free to drop your queries in the comment section.


Great article.Really thank you! Really Cool.